Greyhound Racing & Betting
Harlow Dog Results: The Complete Guide to Racing, Betting & Track Intelligence
Race cards, trap statistics, odds breakdowns and form strategy for every Harlow meeting.

What Harlow Dogs Offers That Most Tracks Don't
Harlow Stadium runs greyhound racing on a 354-metre oval track in Essex, with meetings multiple days each week — making it one of the busiest GBGB-licensed venues for punters chasing results and race-day edge. Unlike flat sprint-only circuits, Harlow offers five race distances from 238m to 946m, which fundamentally changes how form and traps should be assessed across a single card.
Harlow isn't the biggest name in UK greyhound racing, but it's one of the sharpest tracks to bet. The range of distances means a single evening card can shift from a two-bend sprint where trapping speed is everything to a marathon requiring sustained pace and tactical positioning over four laps. That variety creates opportunity — and it punishes punters who apply a one-size-fits-all approach.
Most results pages for Harlow dogs give you raw data: finishing positions, times, starting prices. That information is essential but incomplete. A results page won't tell you why Trap 6 outperforms on 238m sprints, or how a wet Wednesday evening changes every race on the card. This guide bridges that gap — combining track-specific intelligence with the betting knowledge needed to use the data Harlow generates week after week.
What follows covers the full decision chain for a Harlow punter: track layout and distances, interpreting results and form, analysing trap statistics, choosing bet types, reading odds, building a form-based selection method, factoring in conditions, and managing a bankroll that survives regular exposure to one of the most active tracks in the country. Whether you're reading your first Harlow race card or refining a long-standing approach, every section is designed to be independently useful — and collectively, to provide an edge that raw results alone never will.
Harlow Stadium — Key Facts
Track circumference: 354 metres. Race distances: 238m, 415m, 592m, 769m, 946m. Meetings: multiple days per week including morning and evening sessions. Capacity: 1,500 spectators. Location: The Pinnacles, Roydon Road, Harlow, Essex. GBGB-licensed and regulated under the Rules of Racing. (Source: greyhoundracing.co.uk)
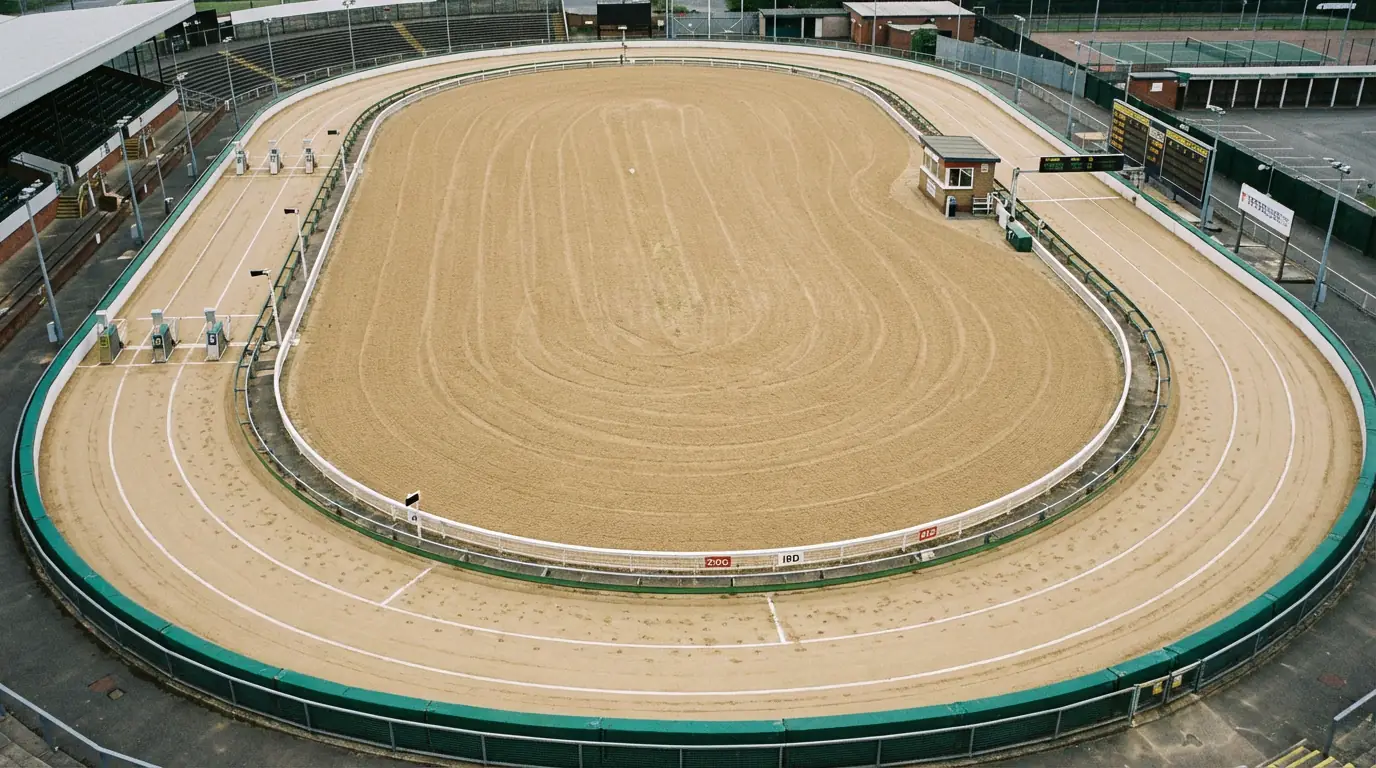
Harlow Stadium at a Glance — Track, Distances & Layout
Every betting decision at Harlow starts with 354 metres of sand and six traps. The track is a standard oval with four bends, an outside Swaffham hare system, and a run to the first bend of approximately 80 metres from the traps. That 80-metre straight is where the majority of 238m sprints are decided and where the first-bend advantage is established for longer distances — a detail that matters far more than most form guides acknowledge.
The oval layout means inside runners have a geometric advantage through the bends, but Harlow's relatively tight circumference amplifies this effect compared to larger tracks like Towcester or Nottingham. On a 600-metre circuit, a wide runner loses a few lengths over four bends. On Harlow's 354-metre loop, those losses accumulate faster relative to the total race distance. The result is a track where trap position and running style interact in ways that demand specific analysis rather than generic assumptions.
Harlow's surface is sand, as with all UK GBGB tracks, and maintenance schedules affect going conditions throughout the week. Morning sessions tend to run on freshly graded sand, while evening cards may see a more compacted surface. This isn't dramatic on dry days, but when rain is involved, the distinction between freshly turned and well-worn track becomes a genuine variable in race outcomes.
The stadium opened in 1995 at the Pinnacles industrial estate, northeast of Harlow town centre. It has a capacity of 1,500 spectators, dining facilities with trackside views, and the Harlequin Suite for hospitality events. For punters who attend in person, the upstairs restaurant provides a direct sightline over the first bend and home straight — the two most important observation points for assessing live running styles. (Source: harlowgreyhounds.co.uk)
Track Circumference
354 metres
Distance Range
238m to 946m
Weekly Meetings
Multiple AM and PM sessions
Race Distances Breakdown — 238m to 946m
The 238-metre dash and the 946-metre marathon are two entirely different sports. The five distances Harlow offers — 238m, 415m, 592m, 769m and 946m — each demand a different running profile, and understanding what each distance rewards is the first step toward reading results with any intelligence.
The 238m sprint covers barely two bends. It starts from a position on the back straight and finishes on the home straight, meaning dogs have minimal opportunity to recover from a slow trap. Early pace is effectively the entire race. A dog that leads into the first bend at 238m wins the overwhelming majority of the time, which is why trap draw and sectional times carry disproportionate weight in sprint races. Slower dogs with strong finishing kicks rarely get the chance to deploy them.
The 415m is Harlow's standard distance and the most commonly run trip on any given card. It covers roughly one complete lap plus a short run-in, giving dogs enough track to recover from early trouble but still rewarding pace off the traps. This is the distance where the broadest range of running styles can compete, and where form analysis tends to be most reliable because the sample size of recent runs is largest.
At 592m — typically a stayers' trip — the race extends to approximately one and a half laps. The extra distance introduces a tactical element: dogs that rate kindly through the first two bends and conserve energy can overhaul frontrunners who emptied the tank early. Sectional times at 592m need to be read differently; a quick first split doesn't guarantee the dog will sustain that effort. Harlow also offers 415m and 592m hurdle variants, which add an additional variable — hurdling ability isn't evenly distributed, and some dogs lose significant momentum clearing obstacles.
The 769m and 946m distances are genuine tests of stamina that attract specialist stayers. Fields at these trips tend to be more predictable because fewer dogs have the conditioning to sustain pace over three or four full laps. For bettors, longer distances often produce results that align more closely with form, simply because the extended race reduces the impact of early trouble and trap bias. A dog badly hampered at the first bend in a 946m race has nearly 900 metres to recover. In a 238m sprint, that same dog is already beaten.
Meeting Schedule and Race Times
Harlow's card rotates between morning and evening sessions across multiple days each week. The track hosts both AM meetings — typically with first races around 10:00–11:00 — and PM meetings with evening starts where first race times sit around 18:00. The precise schedule varies by week and is published on the track's official site at harlowgreyhounds.co.uk, so checking ahead of any planned visit or betting session is essential.
Morning meetings are generally quieter, with smaller crowds and a slightly different atmosphere from the evening cards. For online punters, the distinction matters less visually but more practically: morning cards are broadcast via SIS Racing, and the betting markets can be thinner, meaning early movers can sometimes shift the odds. Evening meetings attract larger on-course audiences and tend to feature stronger graded races, though the quality gap isn't as wide as it once was.
A typical Harlow meeting runs between 10 and 14 races, with intervals of approximately 15 minutes between each. That means a full evening session spans roughly three hours from first to last race. For punters who attend regularly, this frequency creates both opportunity and risk — the sheer volume of racing at Harlow makes it easy to over-bet if you're not disciplined about which races warrant a stake and which are best watched from the sidelines.
How to Read Harlow Dog Results — A Punter's Breakdown
A results page is dense — six dogs, twelve data points per runner, and a story in every line. Learning to read Harlow dog results properly is what separates punters who react to data from punters who simply scan the finishing order and move on. The difference between those two approaches compounds over dozens of meetings.
A standard Harlow result displays the race number, distance, grade, going description and race time at the top. Below that, each of the six runners is listed with their trap number, name, finishing position, distance behind the winner (in lengths), sectional time to the first split, total race time, starting price, and in-running comments. Some results services also show the dog's recent form line — a compressed string of numbers and letters that summarises their last several performances.
The most common mistake punters make when reading results is treating finishing position as the only meaningful data point. A dog that finishes third, beaten four lengths, after being badly baulked at the first bend has run a fundamentally different race from a dog that finishes third in a clean run from a good trap draw. The in-running comments — shorthand annotations like "Bmp1" (bumped at the first bend) or "CrdRnUp" (crowded on the run-up) — tell the story that finishing position alone cannot. Ignoring them is like judging a footballer solely by the match score without knowing they played 70 minutes with ten men.
Race time is another data point requiring context. Harlow's calculated times are track-specific and can't be directly compared to other venues. A 25.50 over 415m at Harlow doesn't mean the same thing as 25.50 at Romford, because track geometry, surface condition, and the hare system all influence raw time. What matters is relative time — how a dog's performance compares to others on the same card, on the same surface, in the same conditions.
The grade is equally important. Harlow uses the standard GBGB grading system, where A1 represents the highest class of graded racing and higher numbers denote weaker grades. A dog winning an A6 race in 26.00 seconds isn't faster than one finishing third in an A1 race in 25.80 — the competition level is entirely different. The result only makes sense once you understand the opposition level the dog was facing. (Source: Timeform — Grading, Rules & Regulations)
Warning: Do not confuse calculated time with actual time. Calculated times are adjusted figures used for grading and comparison within a single track. They factor in the going allowance and other variables. The actual time — what the clock showed — is what you see on the result. They are not the same number, and using one where you mean the other will distort your analysis.
For online punters, the key platforms for Harlow data include the official track site, Sporting Life's greyhound section, and specialist databases like greyhoundstats.co.uk. Each presents the same core data with different emphasis. Building a habit of cross-referencing at least two sources prevents occasional data errors from skewing your analysis.
Decoding the Form Line — What Each Symbol Means
The string of numbers and letters next to every dog's name is a compressed biography. It reads right to left — the most recent run on the right — and each character represents a finishing position or an event that prevented a normal finish.
A form line like 3 2 1 1 4 2 tells you the dog finished third, then second, then won twice, finished fourth, and most recently finished second. That's a dog in reasonable form with consistency across different races. But form lines rarely appear that clean. More typical is something like 4 2 1 6 SAw 3, where the "SAw" (Slow Away) in the fifth run explains the sixth-place finish — the dog missed the break and never recovered. Without reading the abbreviation, you'd think the dog had a bad race. With it, you know the race was compromised by a mechanical issue at the traps, not by lack of ability.
Common abbreviations in Harlow results include: W (wide), M (middle), Rls (rails), indicating running position through bends; SAw (slow away), QAw (quick away), describing trap speed; Bmp (bumped), Crd (crowded), Ck (checked), indicating interference; and RnUp (run up), Fin (finished), describing late-race running. Each of these modifies how you should interpret the finishing position, and learning to read them quickly is a non-negotiable skill for any punter who bets regularly on greyhound racing.
Form lines that include letters like F (fell), RO (ran on — typically used for dogs that finished strongly after a poor start), or Ret (returned to kennels, meaning withdrawn) require particular attention. A fall can leave a dog physically and psychologically affected for subsequent races, and trainers don't always disclose the full extent of the impact. If a dog's form shows an "F" followed by a drop in finishing positions, the fall may have caused a lingering issue that the numbers alone don't capture.
Sectional Times and What They Actually Tell You
A fast split doesn't always mean first to the bend. Sectional times — the time from traps to the first timing point, usually around the first or second bend — measure early pace, but they need careful interpretation at Harlow because the run to the first bend is only about 80 metres.
At Harlow, a sectional time on a 415m race typically records the split from trap to a point near the end of the first bend. A dog clocking a quick sectional might have broken sharply from the traps and led through the bend cleanly. Or it might have been carried wide by a fast inside runner and still posted a quick time despite losing ground on the rail. The in-running comments resolve this ambiguity — but only if you read them alongside the sectional data.
Comparing sectionals across different distances at the same track is valid but requires adjustment. A quick sectional over 238m covers nearly half the race. Over 946m, it measures a fraction of the total distance with three or four full laps still ahead. Fast early pace in a marathon can be a disadvantage if the dog lacks stamina — a concept with direct parallels in horse racing but often overlooked in greyhound analysis.
The most useful application of sectional data is within a single distance at Harlow over a period of weeks. If you track Trap 1's average sectional over 415m across ten meetings, you begin to see whether the inside box genuinely produces faster early pace or whether individual dogs are driving that number. That distinction matters enormously when a new dog is drawn in Trap 1 for the first time — you want to know whether the trap helps or whether the previous occupant was simply quicker out of the boxes.
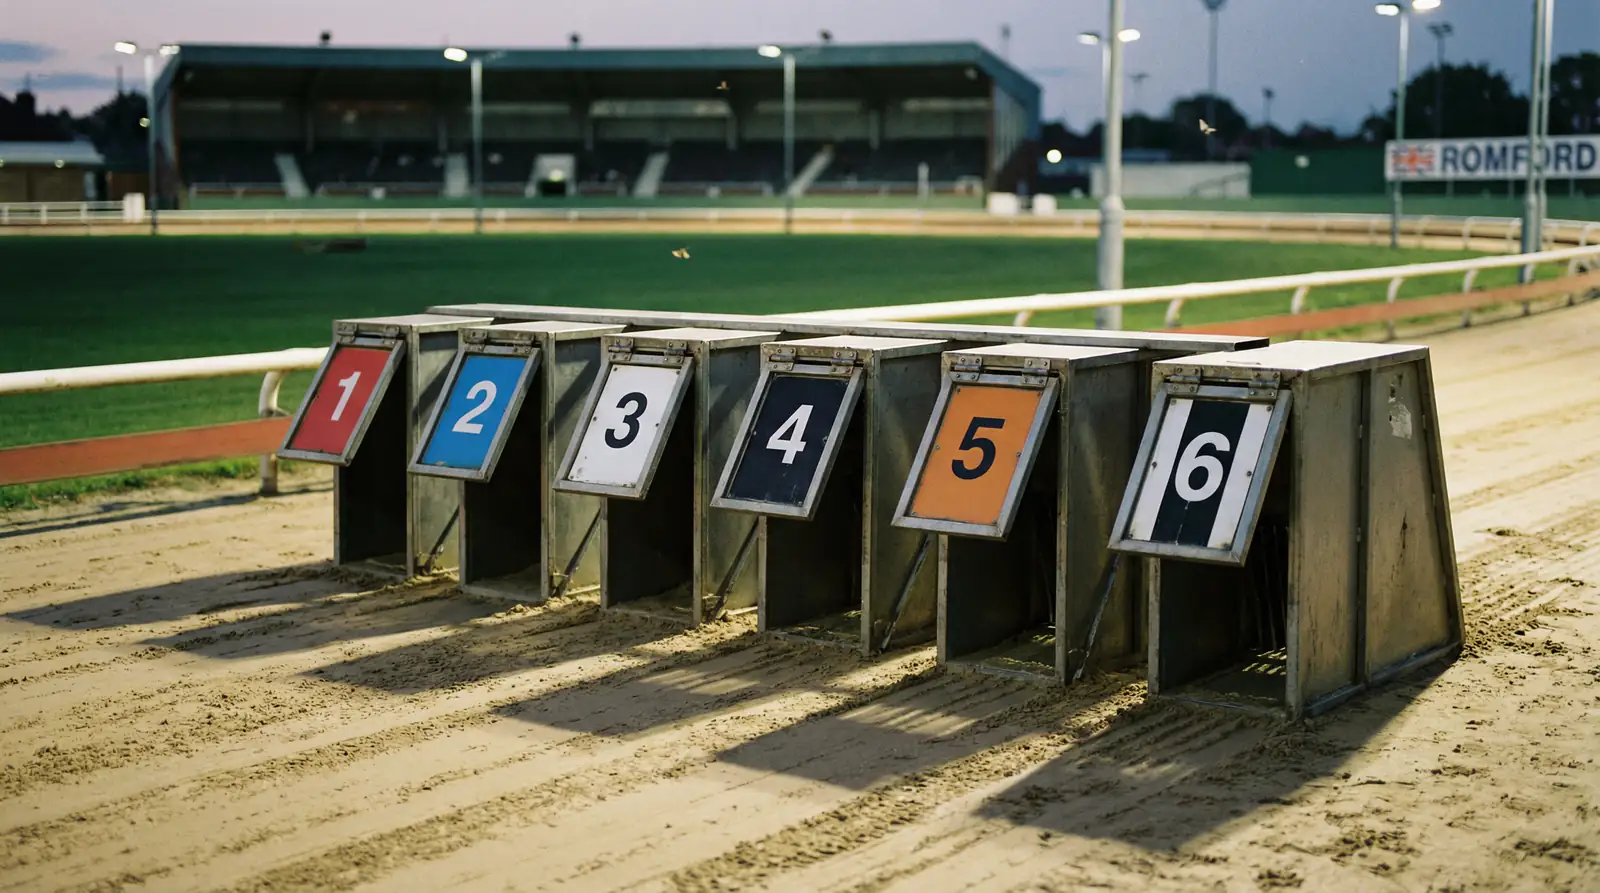
Trap Statistics at Harlow — Which Box Wins Most?
Trap 6 at Harlow has a win rate that consistently outperforms most other boxes — and that number alone should change how you bet. Across UK greyhound racing, trap bias exists at every track, but the magnitude varies depending on circumference, the run to the first bend, and the hare position. At Harlow, the relatively tight 354-metre oval and the outside hare combine to produce trap statistics that reward punters who pay attention to the data.
In a perfectly balanced six-trap race, each box would win approximately 16.7% of the time. Reality never looks like that. At Harlow, outside traps — particularly Trap 5 and Trap 6 — tend to outperform over sprint distances, because the outside running line avoids the congestion at the first bend when four or five dogs converge on the rail. Over longer distances, the advantage shifts toward inside traps as the geometric benefit of the shorter path compounds over multiple laps.
This isn't a fixed rule. Trap statistics reflect historical averages, and any individual race can deviate wildly from the aggregate. A strong railer drawn in Trap 1 racing against five moderate wide runners will likely overcome any statistical bias in favour of Trap 6. The point isn't to bet every Trap 6 dog blindly — it's to use trap data as a filter that adjusts your probability assessment before you look at individual form. If Trap 6 wins 20% of 238m races over a 12-month period, a Trap 6 runner in a sprint needs a compelling reason to oppose, not a compelling reason to back.
Distance-specific trap analysis is where the real value lies. Blanket trap statistics that combine all distances into a single number obscure the patterns that matter. A trap that dominates sprints may be neutral or even negative over 769m. Serious punters build their own distance-by-trap grid using data from sites like greyhoundstats.co.uk, updating it monthly to account for seasonal variation and changes in the kennel roster. With the GBGB's 2026 rule amendments now requiring published reasons for all steward withdrawals, the data available for building these grids is becoming more transparent and reliable than in previous seasons.
One often-overlooked factor is the interaction between trap draw and running style. A wide-running dog drawn in Trap 1 faces a different challenge from a railer in the same box. The trap number tells you where the dog starts; the running style tells you where it wants to go. When those conflict, the dog loses ground — and the aggregate trap statistics absorb that loss, making the trap look worse than it is for dogs whose style actually suits the inside.
Trap 1 — Inside Rail
Shortest path through bends, ideal for railers. Vulnerable to crowding when multiple dogs cut inside at the first bend. Tends to perform better at 592m+ where the distance advantage accumulates. Lower win rate in sprints where congestion at the first bend is more frequent and recovery time is minimal.
Trap 6 — Outside
Clear initial run to the first bend, avoids early traffic. Historically the strongest sprint trap at Harlow due to the outside hare and open racing line. Less dominant over marathon distances where the extra ground covered through bends offsets the clean-run advantage. Best suited to dogs with natural early pace and wide running style.
Greyhound Bet Types for Harlow Meetings
Six dogs, a dozen ways to bet — here's which wagers actually make sense at Harlow. The choice of bet type should be driven by your analysis, not by habit. A win bet and a combination tricast are fundamentally different propositions in terms of risk, reward and the precision of opinion you're expressing. Understanding the full menu before you order is not optional.
The most common bet types available for Harlow meetings are: win, each-way, forecast (straight and reverse), tricast (straight and combination), accumulators, and various niche markets including trap challenges and winning distances. Each carries a different risk profile, and the optimal choice depends on how strongly you can identify the likely outcome of a given race — and how specific that identification is.
Win
The simplest wager: pick the dog that crosses the line first. Win bets are the foundation of greyhound betting. They reward conviction and require the least amount of multi-outcome analysis. Best for races where you have a strong view on a single dog.
Each-Way
Two bets in one — a win bet plus a place bet. If your dog finishes first or second (at most bookmakers for six-runner races), the place part returns at a fraction of the win odds. Each-way is most valuable when backing outsiders with genuine place potential.
Forecast
Predict the first and second dog in exact order (straight) or in either order (reverse). Forecasts pay significantly more than win bets but require a correct opinion on two runners. Strong in races where you can identify two likely protagonists.
Tricast
Predict the first three in exact order. The hardest standard bet, with the highest potential return. Combination tricasts cover all permutations of your selected dogs, multiplying your stake but reducing the precision required.
Accumulator
Chain two or more win selections across different races. The payout multiplies with every leg, but a single loser ends the bet. Popular for entertainment, dangerous as a regular strategy due to the compounding probability of failure.
Trap Challenge
Bet on a single trap number to produce the most winners across a meeting. A niche market that rewards understanding of trap bias over the full card rather than individual race analysis. Available at most major online bookmakers for Harlow meetings.
Forecast and Tricast — How to Bet on Exact Finishes
A straight forecast at Harlow sprints is a different gamble from one over 946m. In a 238m dash, the first two are often decided by trap speed and the first bend — making forecasts harder because the margin between second and third is frequently less than a length. Over marathon distances, the field tends to separate more cleanly, and the top two finishers are often the two dogs with the strongest stamina profiles, making forecasts more predictable in relative terms.
A straight forecast requires you to name the first and second dog in exact finishing order. A reverse forecast covers both permutations — your two dogs finishing first-second or second-first — at twice the unit stake. The payout for a straight forecast is calculated by the computer straight forecast (CSF), which is a formula based on the starting prices of the two dogs. Reverse forecasts pay the average of both possible outcomes, which is typically less than the straight payout but more than a win bet on either dog individually.
Combination forecasts extend the concept to three or more selections. If you pick three dogs for a combination forecast, you're covering six possible first-second combinations — six bets at your unit stake. This broadens your coverage but increases your outlay proportionally. The maths is straightforward: for any number of selections, the number of forecast permutations equals the number of selections multiplied by one less than the number of selections.
Tricast bets — predicting the top three in exact finishing order — are the highest-payout standard wager in greyhound racing. The computer tricast (CT) calculation produces returns that can be significant even for modest stakes, especially in races where an outsider fills one of the first three positions. Combination tricasts, which cover all possible orderings of your selected dogs, multiply quickly: three selections produce 6 lines, four selections produce 24 lines, and five selections produce 60 lines. At a pound per line, a five-dog combination tricast costs 60 pounds — a commitment that demands high confidence in narrowing the field.
How Greyhound Odds Work — Reading the Prices at Harlow
Odds are a language — and most punters only read half the sentence. At Harlow, as at every GBGB-licensed track, greyhound odds represent the bookmaker's assessment of each dog's probability of winning, adjusted by a margin that guarantees the book a theoretical profit regardless of the outcome. Understanding how those odds translate into payouts — and where the bookmaker's margin creates exploitable gaps — is a core betting competency that too many regular punters skip.
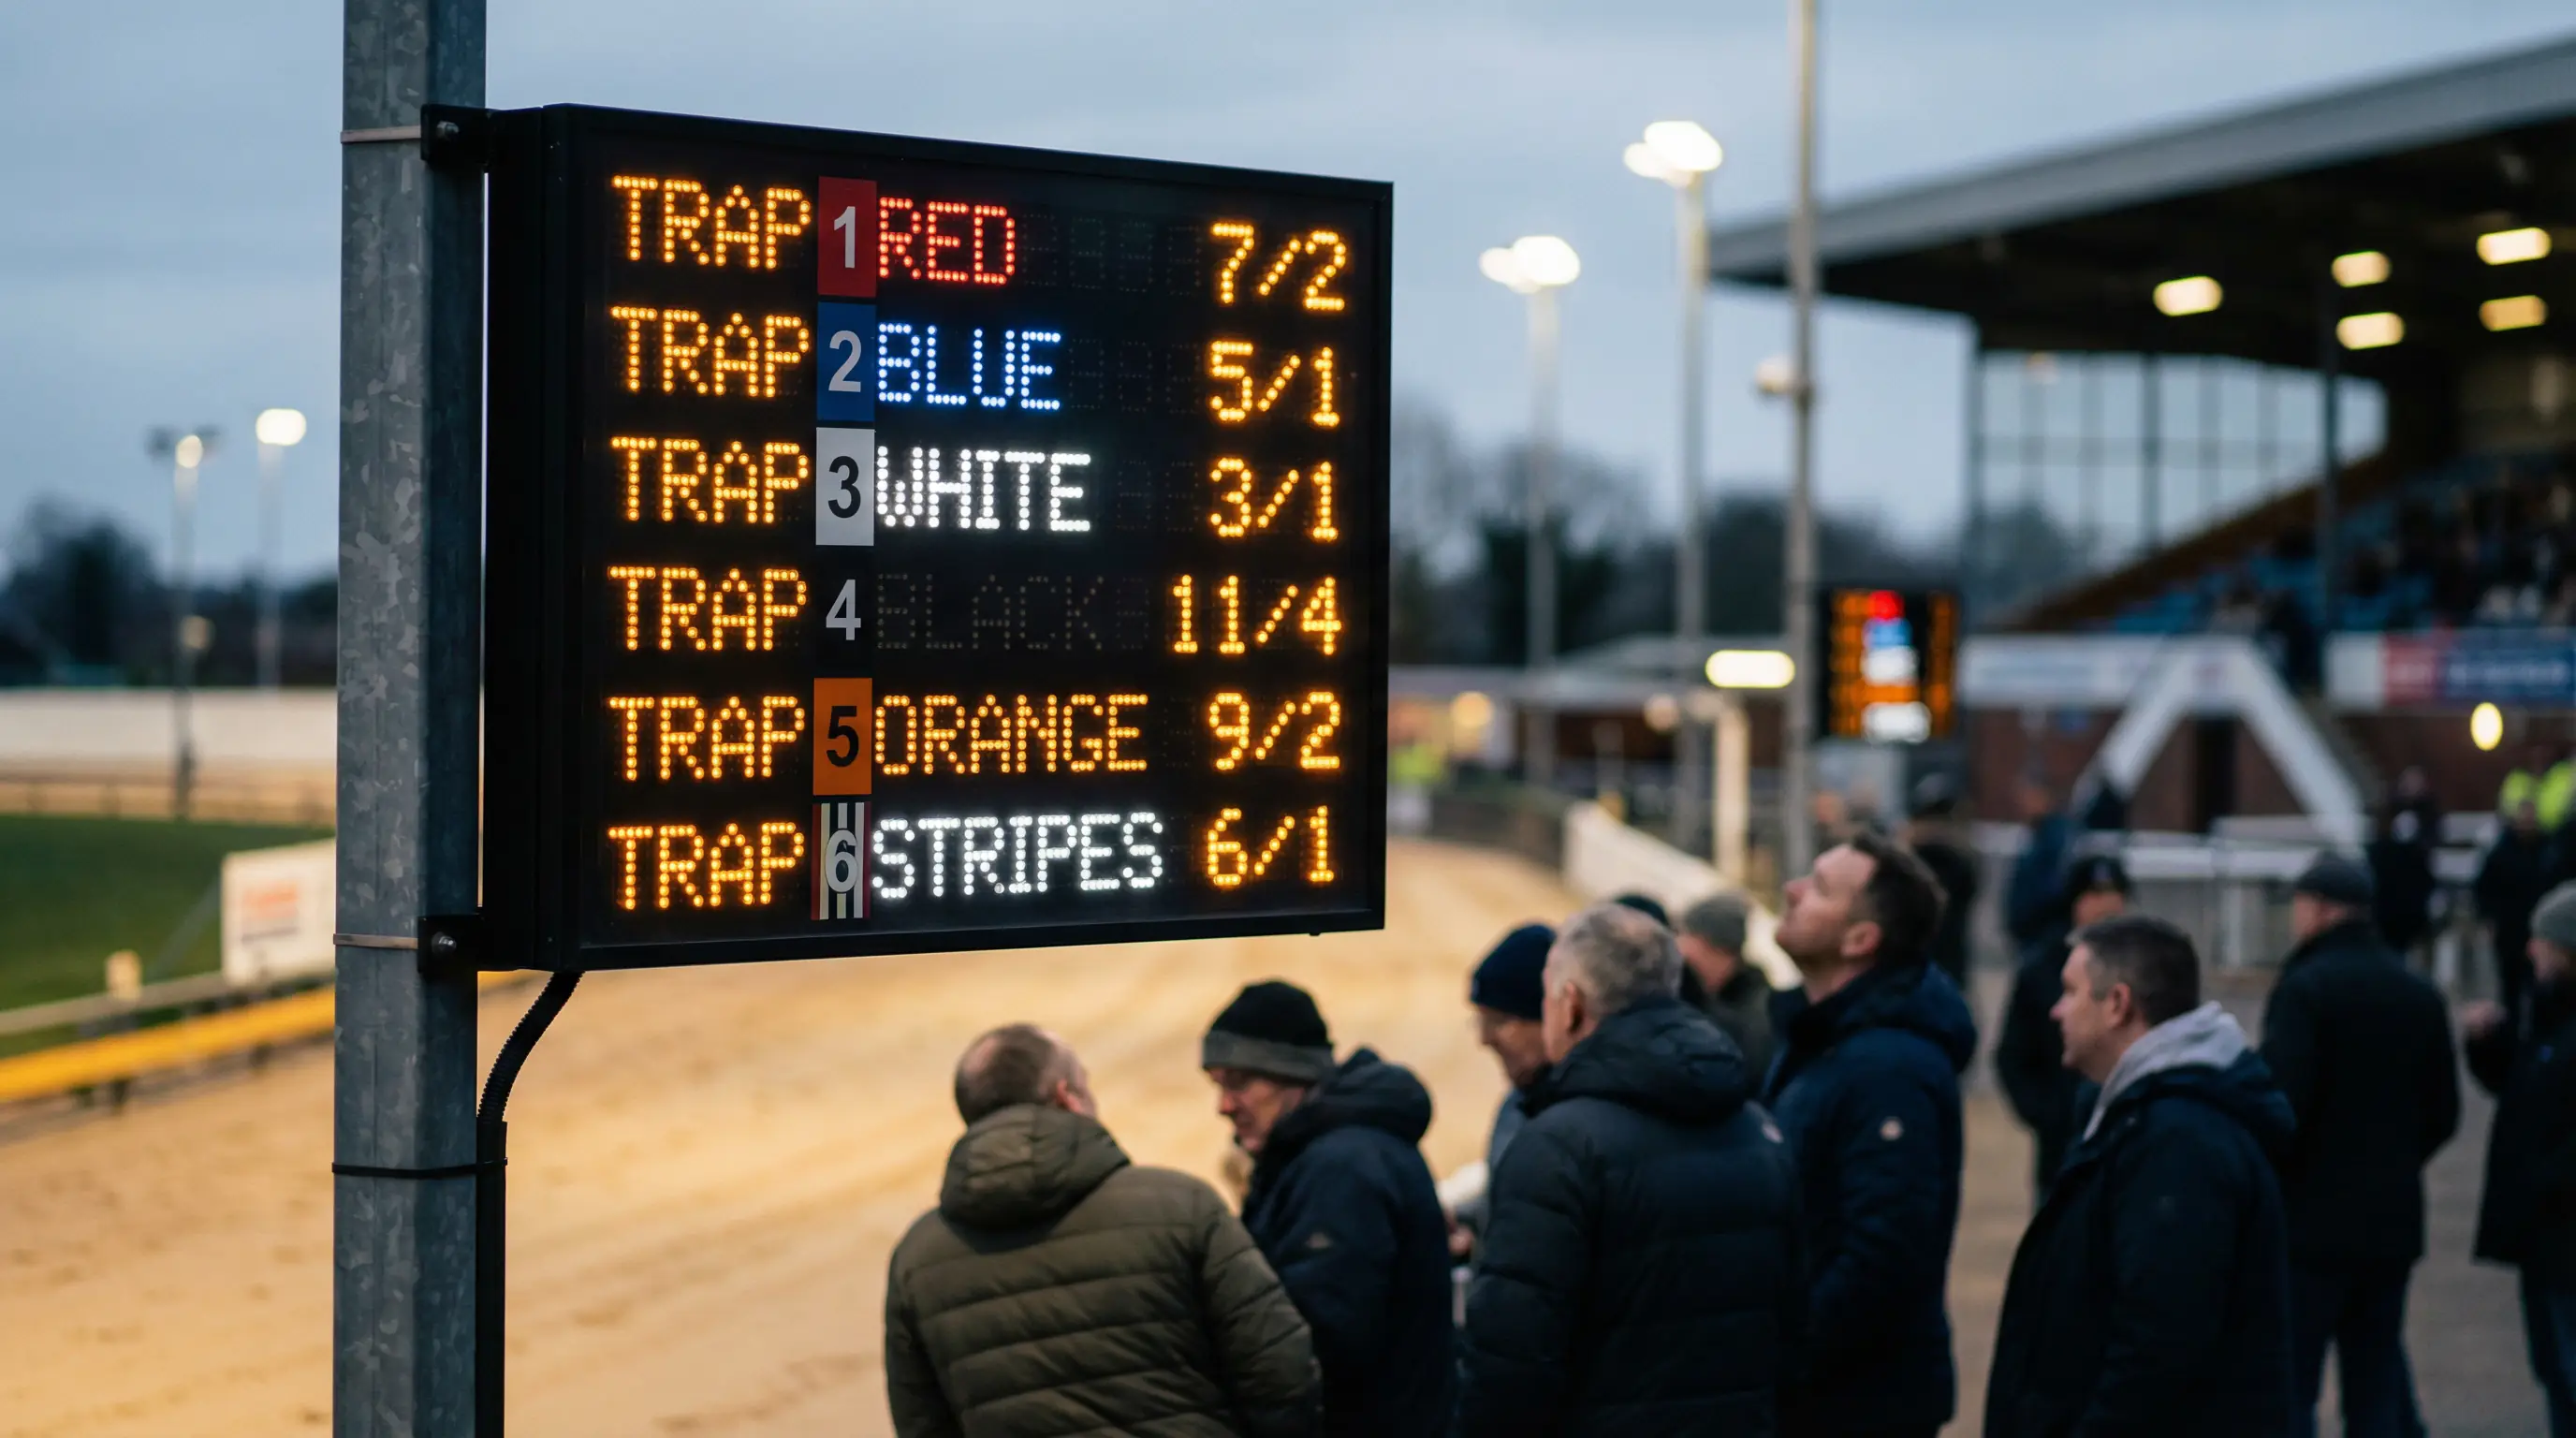
UK greyhound odds are traditionally displayed in fractional format: 7/2, 5/1, 11/4, and so on. The first number represents profit, the second represents stake. At 7/2, you receive seven units of profit for every two units staked — plus your original stake back. So a five-pound bet at 7/2 returns 22.50 pounds: 17.50 profit plus your five-pound stake. Decimal odds, increasingly common on online platforms, express the total return per unit staked: 7/2 fractional equals 4.50 decimal, meaning you receive 4.50 pounds total for every pound wagered.
Starting price (SP) is the final price offered by on-course bookmakers at the moment the traps open. If you don't take a fixed price when placing your bet, you'll be settled at SP. For online bettors, many bookmakers offer "Best Odds Guaranteed" (BOG), meaning if the SP is higher than the price you took, you're paid at the higher number. BOG effectively removes the downside of taking an early price and is one of the most genuinely punter-friendly features in the market. Not all bookmakers extend BOG to greyhound racing, so checking terms before placing bets is worth the thirty seconds it takes.
Value is where odds literacy becomes genuinely useful. A dog at 3/1 implies roughly a 25% win chance (after removing the overround). If your analysis — form, trap draw, conditions, sectionals — suggests a 35% chance, then 3/1 represents value. The dog will still lose about 65% of the time. But over a hundred such bets, backing prices that underestimate the true probability is how profitable punters operate. Betting isn't about finding winners — it's about finding prices that are wrong often enough to matter.
Bet Example
Trap 3 — odds: 7/2 (decimal: 4.50). Stake: 5.00 pounds. Calculation: 5.00 multiplied by 4.50 = 22.50 total return. Profit: 17.50 pounds. Implied probability: approximately 22.2%. If your analysis gives Trap 3 a 30%+ chance, this represents a value bet.
The overround — the sum of all implied probabilities exceeding 100% — is the bookmaker's built-in edge. In a fair six-dog book, the total would be exactly 100%. In reality, it's typically 115% to 130% for greyhound races. Lower overrounds mean better value for the punter, and comparing overrounds between bookmakers for the same race is a simple way to identify who's offering the most competitive odds.
Using Form to Pick Winners at Harlow Dogs
Form isn't everything — but ignoring it is how you go home empty. At Harlow, where dogs run frequently and the grading system ensures relatively even fields, form study is the primary tool for separating contenders from pretenders in any given race. The challenge isn't finding form data — it's knowing which pieces of that data actually predict future performance and which are noise.
The first principle of form analysis at Harlow is recency. Greyhound form deteriorates faster than most punters assume. A dog that ran brilliantly six weeks ago and hasn't raced since is a different proposition from one running consistent form over the last fortnight. Greyhounds are sprinters, and fitness decays rapidly without regular racing. A gap of more than two weeks between runs should prompt the question: is this dog still in the same physical condition?
The second principle is distance relevance. A dog's form at 415m tells you very little about its likely performance at 238m or 769m. The running profiles required for different distances are sufficiently distinct that form at the wrong trip is often worse than no form at all — it creates false confidence. When analysing a Harlow race, filter for the dog's recent runs at the same or similar distance first. Only then expand to adjacent distances if the sample is too small.
Trap form — how a dog has performed from specific trap numbers — adds another dimension. A dog with three wins from Trap 1 being drawn in Trap 5 for the first time is an unknown quantity from that box, regardless of how strong its overall form looks. Some dogs hate being drawn wide; others thrive with clear running room. Trap form is a subset of overall form, and it's the subset that most directly relates to the current race conditions.
Trainer form deserves more attention than it typically receives. Certain trainers at Harlow consistently produce dogs ready to perform on specific meeting days or distances. A trainer with a 25% win rate at Harlow over 415m across the last three months is giving you kennel-level form data that individual dog statistics can't replicate. Trainer data is available through the GBGB's public records and third-party sites, and building a basic understanding of which kennels are in form takes minimal effort relative to the insight it provides.
Do
- Check each dog's recent form at the same distance and trap
- Read in-running comments to distinguish clean runs from troubled ones
- Compare sectional times within the same grade and conditions
- Factor in trainer form over the current month
- Note the going description and adjust expectations for conditions
Don't
- Back the favourite in every race without checking why it's favoured
- Ignore a dog's running style relative to its trap draw
- Compare times across different tracks without adjustment
- Dismiss a dog because of one poor run without reading the comments
- Rely on tips without verifying the underlying form yourself
Early Pace, First Bend Position and Why They Matter
At Harlow, the winning line sits close enough to the first bend that trapping speed decides half the card. The 80-metre run from traps to the first bend is the most important stretch of track for sprint and middle-distance races, and understanding which dogs are likely to lead through that section gives you a structural advantage that form alone doesn't capture.
Early pace is measured by sectional times, but it's best understood by watching races. A dog with a quick sectional that reaches the first bend in front has a qualitatively different race experience from one that reaches the bend in second or third. The leader chooses the racing line — typically the rail — and forces every other dog to either challenge wide or sit in behind and hope for room later. At Harlow's tight circumference, that positional advantage amplifies through each subsequent bend.
First-bend position is the clearest predictor of finishing position in 238m and 415m races at Harlow. Dogs that lead at the first bend win significantly more often than those in second or third, and the effect is strongest in sprints where there simply isn't enough track for a trailing dog to make up the deficit. Over 592m and beyond, first-bend position still matters, but the correlation weakens as the longer distance allows stronger finishers to close the gap over subsequent laps.
For practical selection purposes, identify the fastest trapper in each race using sectional data from recent runs at the same distance. Then assess whether that dog's trap draw gives it a clear path to the first bend or whether an equally fast dog from an adjacent trap could cause early crowding. When two quick dogs are drawn side by side — say Trap 3 and Trap 4 — the first bend frequently produces trouble for one or both. Those races often throw up results at bigger prices because the market favourites have compromised each other, opening the door for a less fancied runner to inherit the lead.
Track Conditions and Weather — The Invisible Form Factor
Rain on sand changes everything — and the racecard won't tell you that. Track conditions at Harlow are a variable that most online punters underweight and most on-course regulars recognise instinctively. The going description published before each meeting — typically ranging from "fast" through "standard" to "slow" — provides a broad indication, but the real impact of conditions on race outcomes is more nuanced than a single word can capture.
Wet weather slows greyhound racing times across the board, but it doesn't slow all dogs equally. Heavier, more powerfully built dogs tend to handle wet sand better than lighter, leggier types, because the extra weight provides better traction on a surface that becomes slippery when saturated. This effect is well documented across UK tracks and is particularly relevant at Harlow, where the Essex location means rain is a regular companion to winter and spring meetings. During the early months of the 2026 racing season, for instance, several Harlow meetings have run on noticeably slower going after persistent rain — and the results from those cards tell a different story from the dry-track form that preceded them.
Wind is the condition most punters ignore entirely. At open tracks, wind affects early pace — a headwind on the home straight can cost a frontrunner its winning margin. At Harlow, the stadium structure provides partial shelter, but the back straight remains exposed. Dogs racing into a headwind over 415m or longer expend more energy maintaining pace, which can flatten their finish. Checking wind direction before a meeting isn't paranoia — it's marginal analysis that separates consistent punters from streaky ones.
Temperature plays a subtler role. Greyhounds are sprinting animals with a high muscle-to-body-mass ratio, and their performance is sensitive to thermal conditions. Cold evenings can stiffen muscles and slow reaction times out of the traps. Very warm conditions can lead to overheating in dogs racing for the second time in a week. If a dog that normally breaks fast shows an uncharacteristically slow sectional on a cold night, temperature may be a factor worth noting before you write off its form.
Heavier greyhounds statistically perform better on wet Harlow sand — a quirk of the surface drainage that rewards power over agility when the going turns soft.

Bankroll Discipline for Regular Harlow Punters
The dogs run multiple times a week — your wallet doesn't recover that fast. Harlow's busy schedule is a double-edged proposition for regular punters: more meetings means more opportunities, but it also means more exposure to loss. Without a disciplined bankroll strategy, the volume of available racing at a single track can erode a betting bank faster than poor selections ever could.
The foundation of bankroll management is the session limit. Before logging on to bet or walking through the turnstile, decide how much you're prepared to lose in that session and treat it as a hard ceiling. Not a guideline, not a number you'll reconsider if the last race looks like a certainty — a ceiling. Professional bettors typically risk between 1% and 3% of their total bankroll per bet, which means a 500-pound bank should produce individual stakes of between 5 and 15 pounds. That sounds conservative, and it is. But it's conservative because it's designed to survive the losing runs that even the best form analysts experience.
Staking plans fall into two broad categories: level stakes and variable stakes. Level staking means betting the same amount on every selection. Variable staking — adjusting bet size based on your confidence — is more sophisticated but dangerous if your calibration is poor. For Harlow regulars building their analysis skills, level stakes removes one variable and makes it easier to track performance over time. Once you can demonstrate a positive ROI over at least 200 bets at level stakes, you've earned the right to experiment with variable approaches.
Record-keeping is the most unglamorous and most essential habit in betting. Every bet you place at Harlow should be logged: date, race, dog, trap, odds taken, stake, and outcome. Over a month of regular betting, that data reveals patterns that subjective memory obscures — you might discover you're profitable on 415m races and losing money on sprints, or that your forecast bets are consistently underperforming compared to your win singles. Without the data, you're guessing about your own performance, which is exactly as useful as guessing about the dogs.
Chasing losses — increasing stakes after a losing run — is the single most common reason recreational punters escalate from a manageable loss to a damaging one. Harlow's multi-session schedule creates constant temptation to chase, because the next meeting is never more than a day away. Discipline here isn't a personality trait — it's a system. If your rules say stop after three consecutive losses in a session, you stop. The dogs will still be there tomorrow.
Pre-Bet Checklist
- Set a session spending limit before the first race
- Check recent form for every dog in the race — not just the favourite
- Assess going conditions and check weather at the track
- Compare odds across at least two bookmakers
- Review the trap draw against each dog's running style and distance form
Harlow Dog Results — Frequently Asked Questions
Three questions that come up before almost every Harlow meeting.
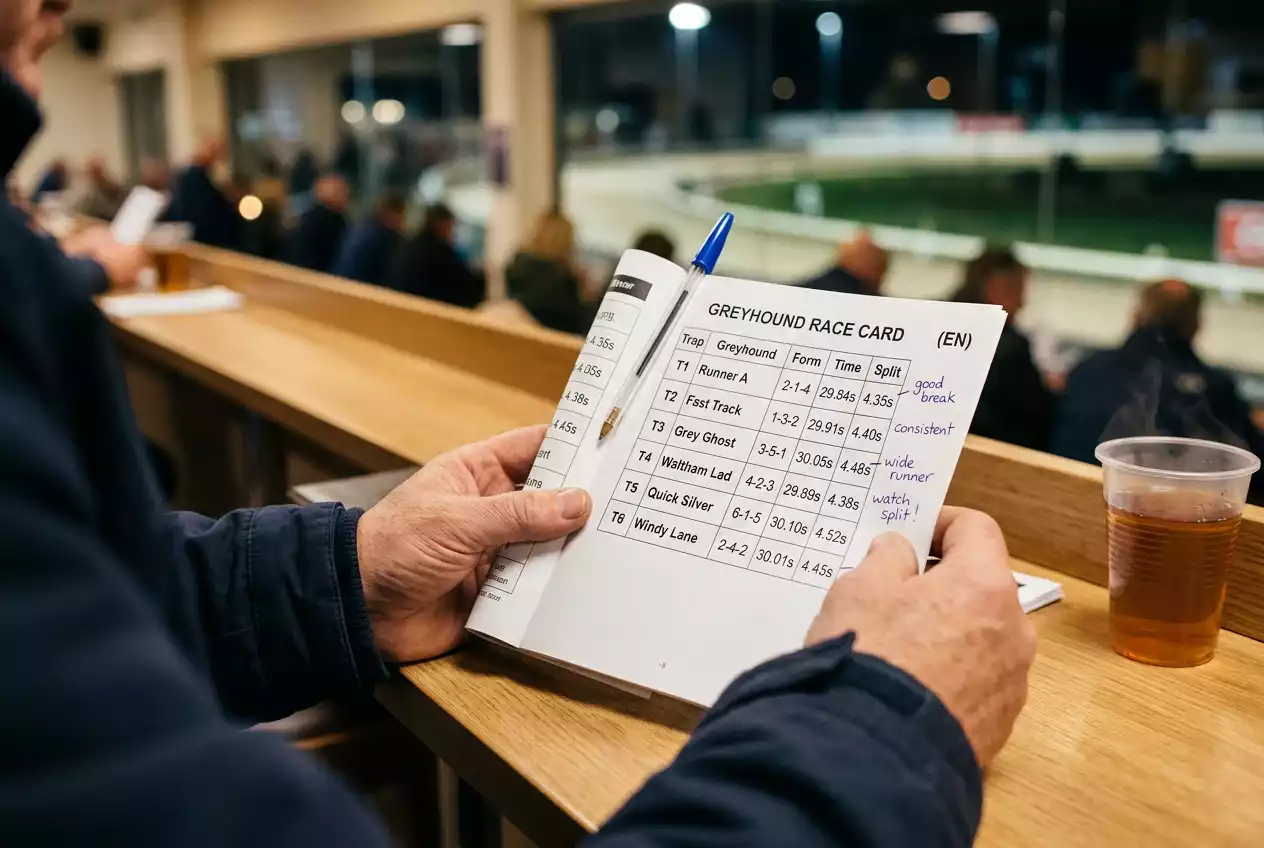
How do I read a greyhound race card?
A greyhound race card lists every runner with their trap number, trainer, recent form, best times, and grading information. The form line — a sequence of numbers and letters — summarises recent finishing positions and in-running events. Numbers represent finishing positions, while abbreviations like SAw (slow away), Bmp (bumped) and Crd (crowded) explain what happened during the race. Reading the card effectively means looking beyond finishing positions to the context each abbreviation provides — a dog that finished fourth after being bumped at the first bend ran a fundamentally different race from one that finished fourth in a clean run. For Harlow cards specifically, pay close attention to sectional times and trap draw, as the track's tight circumference makes both factors unusually influential.
What are the race distances and best traps at Harlow?
Harlow Stadium offers five race distances: 238m (sprint), 415m (standard), 592m (stayers), 769m and 946m (marathon). The track also hosts hurdle races at 415m and 592m. Regarding trap performance, the outside traps — particularly Trap 5 and Trap 6 — historically outperform over sprint distances at Harlow, benefiting from the outside hare and a cleaner run to the first bend. Over longer distances, inside traps become more competitive as the shorter path through bends accumulates an advantage over multiple laps. Trap statistics vary by distance, so the "best trap" depends entirely on which trip is being run. Check distance-specific trap data rather than relying on overall numbers.
What is the difference between a forecast and a tricast bet?
A forecast bet requires you to predict the first two finishers. A straight forecast demands exact order; a reverse forecast covers both orderings at double the stake. A tricast extends this to the first three in exact order. Payouts are calculated by the computer straight forecast (CSF) or computer tricast (CT) formula based on starting prices. Tricasts pay more because predicting three in order is significantly harder. Combination versions allow more selections covering all permutations, increasing outlay but reducing precision needed. Forecasts work best when you can identify two likely protagonists; tricasts require either a very strong opinion on three dogs or willingness to accept the higher combination cost.
The 354-Metre Edge — What Harlow Rewards
Harlow doesn't hand out winners — it hands out information, and punters who use it run further. The track's combination of five distances, regular meetings, and a tight oval layout creates a racing environment where preparation is rewarded more consistently than luck. That's not true of every track, and it's certainly not true of sports betting in general. But at Harlow, the data is there — in the results archive, in the form lines, in the trap statistics, in the going reports — and the gap between punters who process that data and those who don't is measurable in pounds over any sustained period.
The 2026 greyhound racing season — the sport's centenary year in the UK, marking 100 years since the first race at Belle Vue Stadium in Manchester on 24 July 1926 (GBGB — 100 Years on Track) — has brought renewed attention to the GBGB circuit, with updated rules of racing taking effect from January and an expanded Category One and Two open-race schedule that includes more sprint events than previous years. Harlow's place within that circuit remains as it has been for three decades: a working track that produces consistent, competitive racing for punters who value substance over spectacle. The dogs don't care about history. They care about the sand under their feet, the trap they're drawn in, and the first bend that's 80 metres away. Your job is to care about all of that, plus the numbers that tell you what happened last time.
Everything in this guide connects back to a single process: observe, record, analyse, bet, review. Read the results. Study the form. Check the traps. Assess the conditions. Choose your bet type deliberately. Manage your bankroll. Then do it again next meeting. The 354 metres of track don't change. The dogs do, the conditions do, the odds do — and your ability to read those changes is the only sustainable edge available.
The Harlow Edge
Consistent access to form data, frequent meetings, a distance range that rewards specialisation, and a trap bias that punishes lazy analysis. The information advantage at Harlow isn't exclusive — it's available to every punter willing to do the work. The edge belongs to those who actually do it.